Developers of extensions for Visual Studio Team Services (or Team Foundation Server) tend to use Application Insights to collect telemetry about their extensions.
Metrics like usage, performance, errors are collected to know which features are used, which features are working, how they are performing and if they are failing to improve them and better deliver value to its end users.
There are several types of extensions
- Dashboard widgets
- Hubs
- Actions
- Work Item form elements
- Build and release tasks
Except for build and release tasks, all other extensions types run in a web browser, so it is easy to collect telemetry and Application Insights is a natural fit.
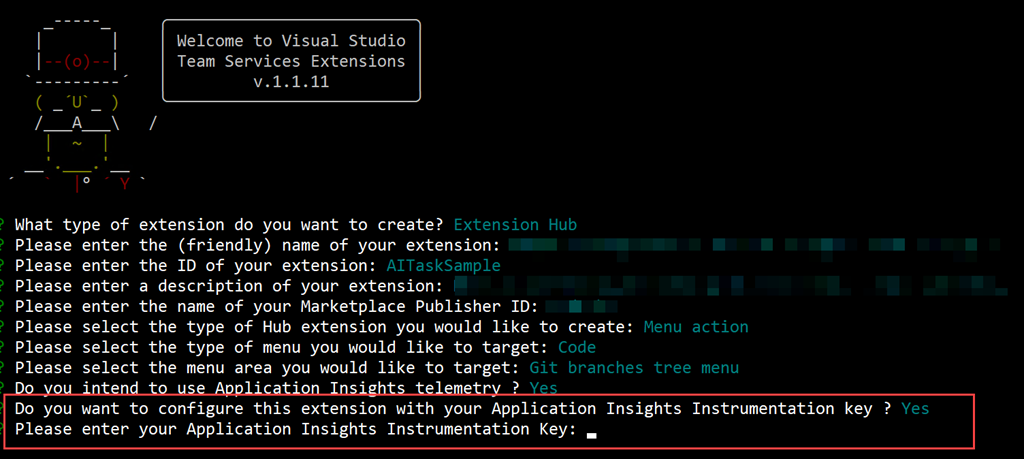
There is plenty of information how to integrate Application Insights with your extensions (here and here just to reference a few), if you use the ALM | Devops Rangers generator-vsts-extension to generate the skeleton of your extension Application Insights support is automatically (optional) added for you.
At first look, it might seem that we cannot use Application Insights for build & release tasks since they do not run in a browser and we are stuck with the statistics that Visual Studio Marketplace provides us (installs and uninstalls numbers).
In this post I’m going to show, how you can use Application Insights to measure usage of build & release tasks (referred as tasks from now on)
Tasks are implemented in either PowerShell or JavaScript, tasks should preferably be implemented in JavaScript since they can be executed in all platforms (build and release agent is cross platform and can run in Windows, Linux or MacOs) unless there is a strong reason to implement them in PowerShell (which can only run in Windows agent)
I’m going to explain how Application Insights can be used in a task implemented in JavaScript (using TypeScript to be more exact) but the same technique can be used in PowerShell
Below you can see the most straightforward implementation of an extension (in TypeScript)
import require 'vsts-task-lib/task'

async function run() {
  try {
    } catch (err) {
        tl.setResult(tl.TaskResult.Failed, err.message);
    }
}

run();
In order to collect telemetry we need to install Application Insights for Node.js NPM module (eg: npm install applicationinsights save)
Next, we need to import the module and initialize it by adding the follow snippet (outside the Run function) [don’t forget to enter your Application Insights instrumentation key or externalize it)
appInsights.setup('INSERT APPLICATION INSIGHTS INSTRUMENTATION KEY')
    .setAutoDependencyCorrelation(false)
    .setAutoCollectRequests(false)
    .setAutoCollectPerformance(false)
    .setAutoCollectExceptions(false)
    .setAutoCollectDependencies(false)
    .setAutoCollectConsole(false)
    .setUseDiskRetryCaching(false)
    .start();

var client = appInsights.defaultClient;
Application Insights SDK is initialized, auto collection has been disabled and data collection has been started.
We now need to collect information we want explicitly.
Tracking Usage
For our example, these are the requirements
- Track how many executions times an extension had
- How many accounts/collections are actively using the extension
- Get errors in order to track issues that users don’t bother to report.
- Don’t collect any user data nor use any information that may lead to user identification; all information is anonymous.
You may have others, but these are the ones we are going to solve in this post.
There are several kind of events we can send to Application Insights, we can track things like Page views, events, metrics, exceptions, request, log traces or dependency.
Since we only want to track usage we have two choices track a request or track a custom event.
Track using a request event
Conceptually the execution of a task is not a request; the request represents a web request. Semantics apart the request is a suitable way to track task executions even if we are stretching the request definition a little.
If we use a request these are some things we get out of the box
- We can track the response time of the task execution (typically this doesn’t matter since a task may be executed in machines with very different specs, or different data specs)
- Usage (and performance) data is visible on application insights summary blade
- This also means you can use VSTS Application Insights widget to display data on your VSTS dashboards
- Failed task executions are also visible
We need to call the track request API call, and provide the following parameters
- **Name ** Name of the request, we can use the task name on this field.
- URL Since we don’t have an URL we can use anything we want here (it doesn’t need to be a valid URI) so we can use either Build or Release to know if the task was executed in a build or a request
- Duration The execution time (if we want to track performance, otherwise use 0)
- Success status If the request was successful or failed.
- Result Code The result code (use anything you want, but you need to specify it, otherwise the request is ignored)
There is just one thing missing, how can we track usage across accounts, for that we can use properties that are sent in every event as custom dimensions. This would be the implementation of our task
async function run() {
  try {
      //do your actions
      let taskType = tl.getVariable()"Release.ReleaseId") ? "Release Task" : "Build Task";

        client.commonProperties = {
            collection: tl.getVariable()"system.collectionId"), projectId: tl.getVariable("system.teamProjectId")
        };


        client.trackRequest({ name: )"taskName", url: taskType, duration: 0, success: true, resultCode: )"OK" });

    } catch (err) {
        tl.setResult(tl.TaskResult.Failed, err.message);
    } finally {
        client.flush();
    }
}

run();


Notice we send the collection id and the team project id, these are GUID's that are opaque, they do not reveal any client information and can’t be used to track them, but if you are worried, you can be extra cautious and pass them through a hash function for further anonymization.


### Tracking using a custom Event


A custom event can be used to send data points to Application Insights; you can associate custom data with an event. You can use data that can be aggregated (to be viewed in metrics explorer) or data to available in Search. Both are queryable in Application Insights Analytics.


```typescript

async function run() {
    try{

        //do your actions

        lettaskType = tl.getVariable("Release.ReleaseId") ? "Release Task": "Build Task";

        client.trackEvent({ "name": "Task Execution", "properties": { "taskType": taskType, "taskName": "taskname", "collection": tl.getVariable("system.collectionId"), "projectId": tl.getVariable("system.teamProjectId") } });

    } catch(err) {
        tl.setResult(tl.TaskResult.Failed, err.message);
    } finally{
        client.flush();
    }
}
We the event, I opted to use Task Execution for the event type name , it allows us to quickly count the number of task executions (regardless if it is in a release or a build context) and if we need to get the context where the task has been executed, we can get it from the taskType property.
Errors Telemetry
Finally we want to get error information, so we add the following code to the catch handler
}  catch (err) {
    client.trackException({ exception: err });

    tl.setResult(tl.TaskResult.Failed, err.message);
}
If we just send exception event, we will miss the task execution failures, so we need to call the event (either trackEvent or trackRequest) or we will not have usage data for task failures.
If we are using events this would be the code for that catch handler
} catch (err) {
    client.trackException({ exception: err });

    let taskType = tl.getVariable("Release.ReleaseId") ? "Release Task" : "Build Task";

    client.trackEvent({ "name": "Task Execution", "properties": { "failed": true, "taskType": taskType, "taskName": "taskname", "collection": tl.getVariable("system.collectionId"), "projectId": tl.getVariable("system.teamProjectId") } });

    tl.setResult(tl.TaskResult.Failed, err.message);
}
Noticed we added a failed property to the properties object
If we are using request events this would the catch handler
} catch (err) {
    client.trackException({ exception: err });

    let taskType = tl.getVariable("Release.ReleaseId") ? "Release Task" : "Build Task";

    client.commonProperties = {
        collection: tl.getVariable("system.collectionId"), projectId: tl.getVariable("system.teamProjectId")
    };

    client.trackRequest({ name: "taskName", url: taskType, duration: 0, success: false, resultCode: "Error" });

    tl.setResult(tl.TaskResult.Failed, err.message);
}
The only difference is that we are setting sucess property to false, so the request appears in the failed requests.
Sending Data
To make sure data is sent (the SDK batches data) we call the flush method on the finally handler to guarantee data is sent to Application Insights before the task execution finishes.
} finally {
  client.flush();
}
Opting In/Opting out
Optionally you can allow users to either opt in or opt out via a task parameter and users can decide if they want to contribute to anonymous telemetry data.
Telemetry can be disabled via the disableAppInsights property of the client config property.
var client = appInsights.defaultClient;

client.config.disableAppInsights = !enabled;
Analyzing Data
After deploying the tasks with telemetry collection enabled we are now ready to analyze usage data.
We have several ways to visualize or analyze Application Insights data; we can use Azure Portal or Application Insights Analytics
Note: this is not a primer on Application Insights, it is just a glimpse of some ways to analyze the data collected from tasks.
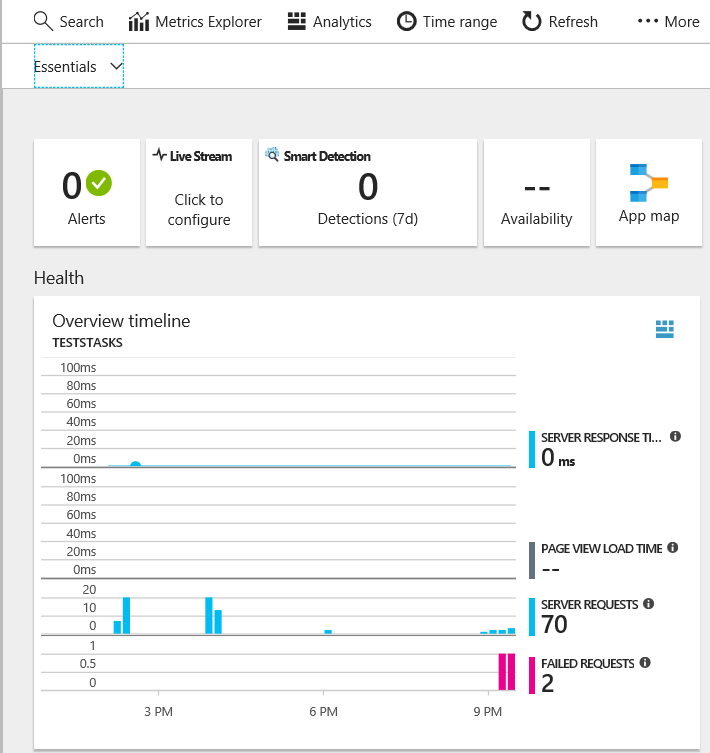
Azure Portal
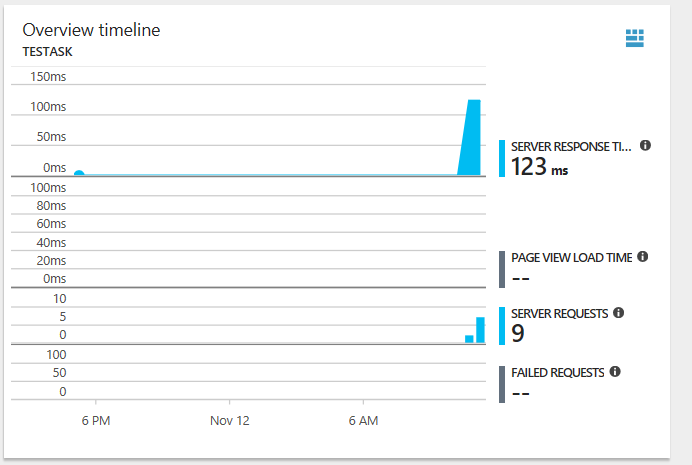
If you decided to go with the track request route, all executions are visible immediately on the Overview blade
If you decided to go the event’s route, You could get a similar graphic by opening Metrics explorer and configuring the chart to display Events and grouping it by Event Name.
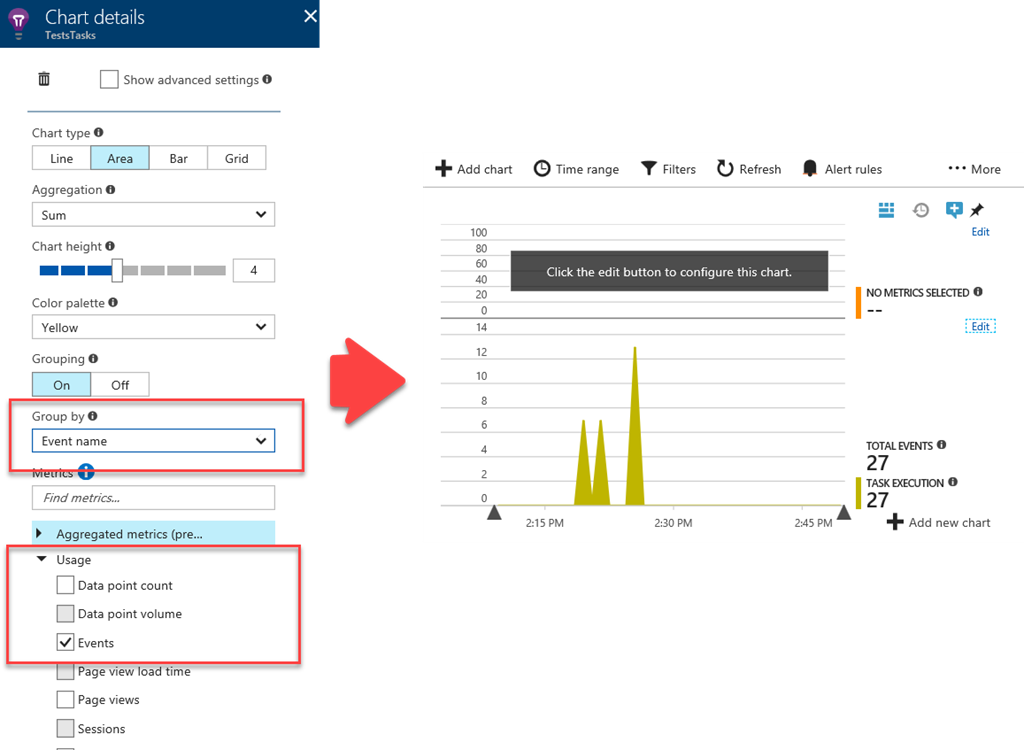
You can also group by Operating System to see if tasks were executed on a windows, Linux or MacOS agent.
If you wish to see event details, just click on the search and click on the event [1] you wish to inspect
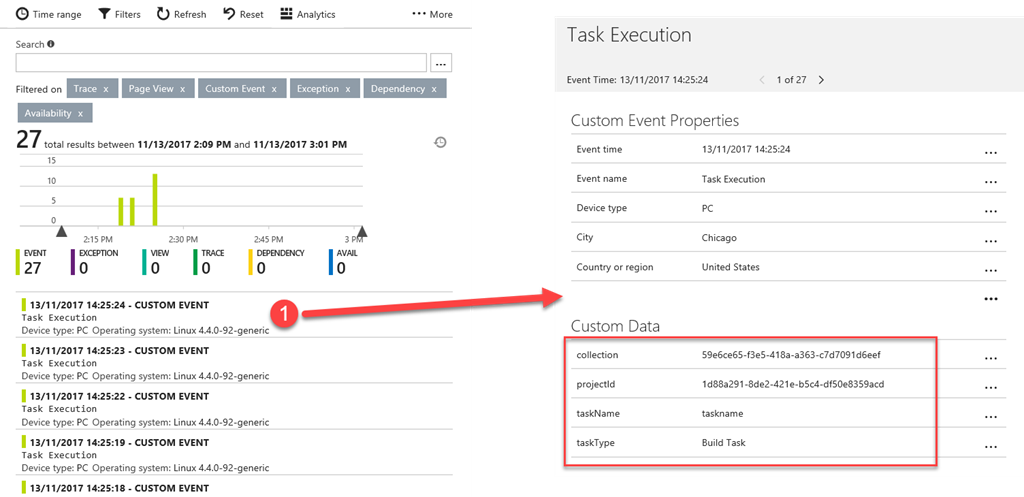
You can see on Custom data, the custom event data we have sent. The collection identifier, the project identifier, the name of the task and the where the task has been executed (Build in this case).
Application Insights Analytics
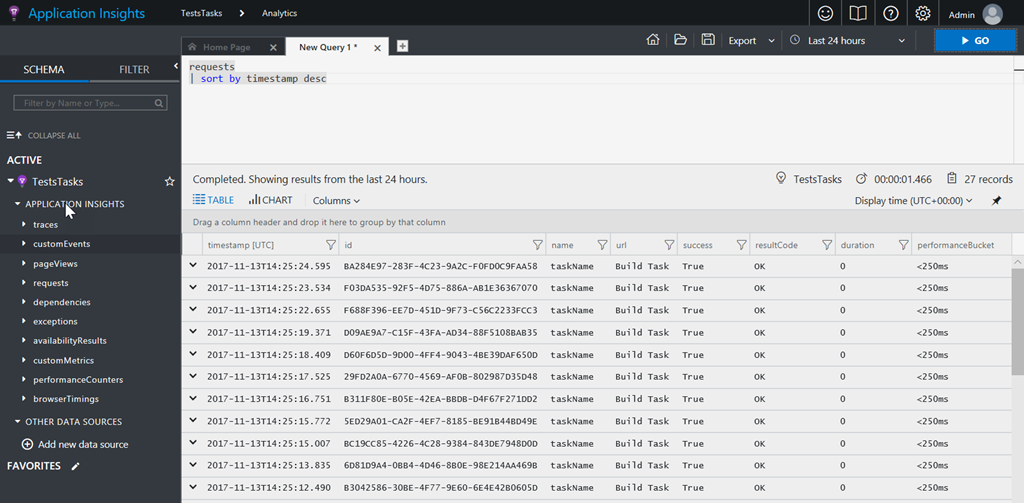
Application Insights Analytics provides you with a search and query tool to analyze Application Insights data.
Let’s start with the simplest query, list all the requests ordered by date
To get an idea how tasks executions over time and which platform the agent is running on, we can render the following chart (data is grouped in 5 min intervals)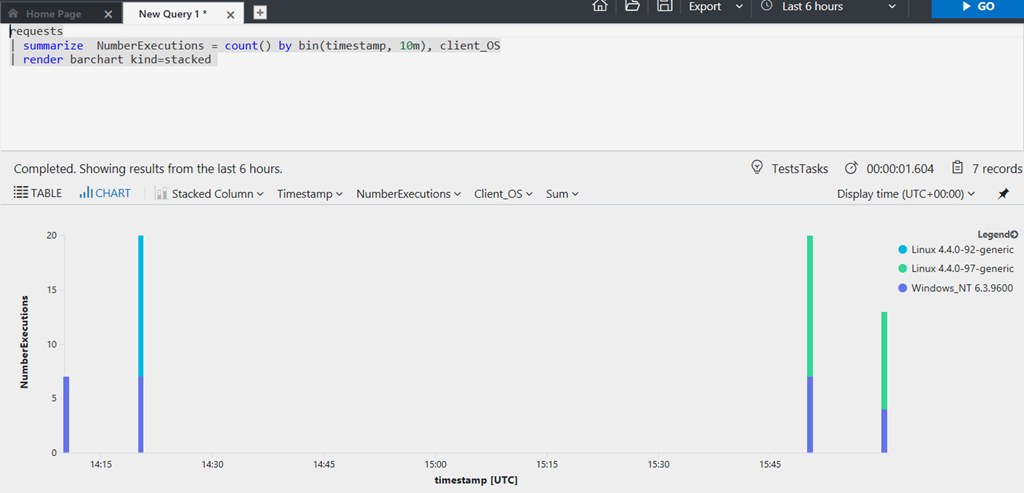
However, we can use it to answer, more elaborate questions. Like in how many executions each task had in distinct team projects (we could also get how many different accounts, but it is easier to demonstrate with single account)
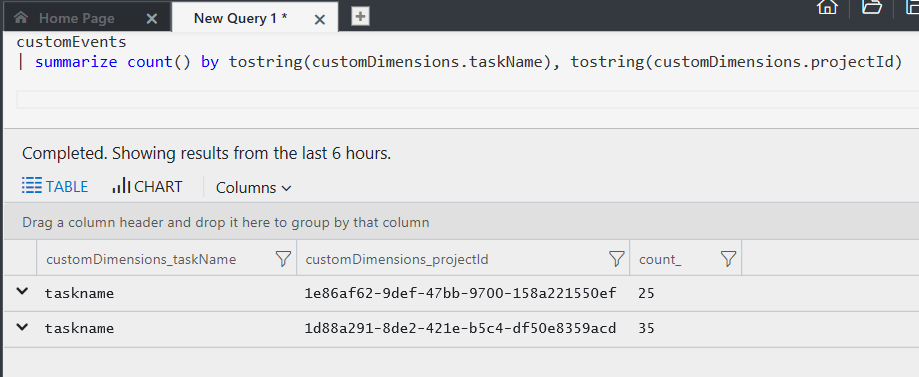
In the last six hours, the task called “taskName” has been executed 60 times in two different team projects.